Your bid does not win the auction. Your Quality Score does.
Two advertisers can target the same keyword with the same daily budget. The one with a higher Quality Score pays less per click, earns better positions, and generates more conversions from the same spend. The one with a lower score pays a premium on every click and still ends up lower on the page.
Here is how significant this problem is: according to 2026 benchmark data from Digital Applied, 36% of all Google Ads keywords carry a Quality Score of 5 or below. That means more than one-third of all advertiser spend is actively overpaying per click right now.
Understanding the factors that determine ad quality in Google Ads is not optional when CAC efficiency and ROAS are on the line.
Google calculates Quality Score on a scale of 1 to 10 for each keyword in your standard Search campaigns. This score is built from three components: expected CTR, ad relevance, and landing page experience. These Google Ads Quality Score components each receive a status of below average, average, or above average. Google uses these inputs to produce a diagnostic score that reflects the quality of your ads relative to competitors. This score informs Ad Rank, which determines your actual position and cost per click in every auction.
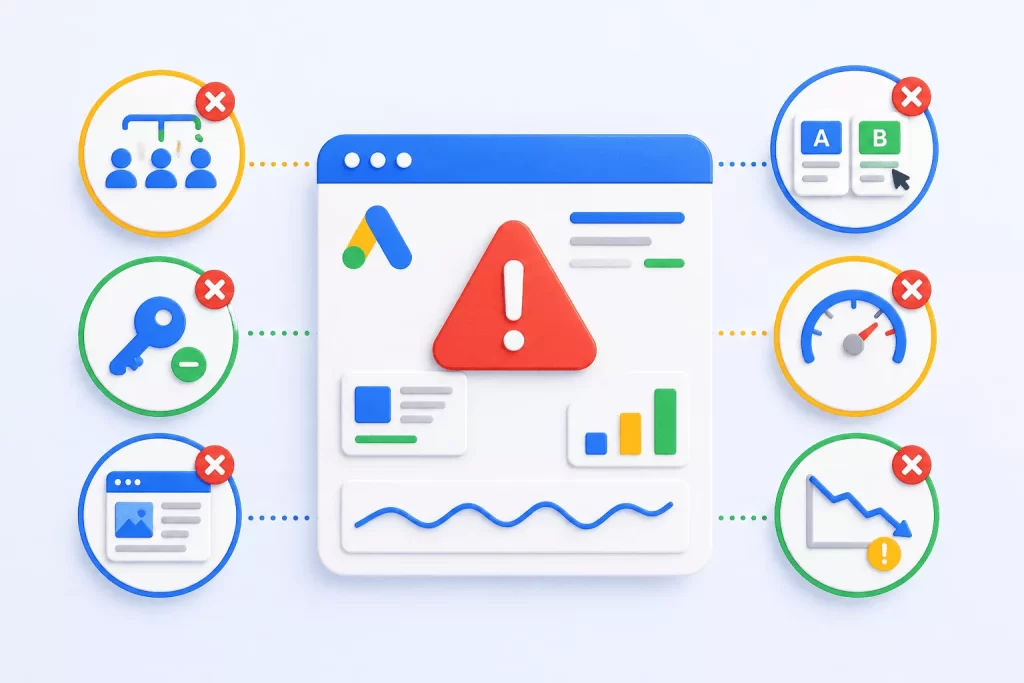
The Three Main Factors That Determine Ad Quality in Google Ads

Factor 1: Expected CTR
Expected CTR is Google’s prediction of how likely a user is to click your ad when it appears for a given keyword, relative to other ads competing for the same term. It draws on historical performance data from your account, from other advertisers bidding on the same keyword, and from how that keyword behaves across Google’s platform.
This is not the same as your actual CTR. Expected CTR is a forward-looking estimate. Google asks: based on everything known about this keyword and this ad, how often will users click? If your ad consistently earns clicks relative to its impressions, your expected CTR status improves. If it underperforms, it pulls your Quality Score down.
Expected CTR carries the heaviest weight of the three Quality Score components. A strong expected CTR tells Google that users find your ad relevant and compelling.
One thing many advertisers miss: your account’s overall CTR history affects how new keywords are scored from day one. If your account has a pattern of underperforming ads, new keywords start with lower expected CTR ratings. This is why cleaning up poor performers across your account matters well beyond the individual keyword.
A below average Quality Score status on expected CTR means your ad is earning fewer clicks per impression than competitors targeting the same keyword. Either the copy is not matching what users search for, or the ad is appearing for queries where it is not a strong fit.
Factor 2: Ad Relevance
Ad relevance measures how closely your ad copy aligns with the intent behind the user’s search query. Google compares the language in your headlines and descriptions against the keywords in your ad group and the search terms triggering your ad. A strong match signals that your ad addresses what the user is actually looking for.
This is the Quality Score component you can control most directly. The most common cause of a below average ad relevance status is ad groups that are too broad, containing keywords from different intents bundled together under the same ads. When copy cannot speak specifically to each search intent in the group, relevance scores drop.
Ad relevance also reflects keyword-to-ad alignment. If someone searches for “Google Ads management for ecommerce” and your headline reads “PPC Services for All Businesses,” the match is weak. If your headline reads “Google Ads Management for Ecommerce,” the match is strong. Tightly themed ad groups with copy written around specific search intent consistently produce above average ad relevance status.
A below average ad relevance status means your ad group likely contains too many unrelated keywords, or your copy is too generic to reflect the specific intent behind each search triggering it.
Factor 3: Landing Page Experience
Landing page experience measures how relevant, useful, and navigable your landing page is to someone who clicks your ad. According to Google’s published guidelines, Google evaluates three things: whether the page contains relevant and original content that directly relates to the user’s search, whether the site is transparent about who operates it and what it offers, and whether the page is easy to navigate.
Page speed is a significant factor. A landing page that loads slowly creates a poor user experience, and Google factors this into its assessment. On mobile, where a large share of searches happen, slow load times drive high bounce rates and suppressed Quality Scores.
The link between landing page experience and conversion rate is direct. A page that scores above average Quality Score status with Google tends to also convert visitors at a higher rate. Improving landing page experience is not just about Quality Score. It is about making the post-click experience match the promise your ad made.
A below average landing page experience status means your landing page does not match the intent of the ad driving traffic to it, the content is thin or generic, the page is hard to navigate, or load times are slow.
How Google Measures Each Quality Score Component
Google compares your ad’s performance against other ads that competed for the same keywords over the past 90 days, according to Google’s Quality Score documentation. Each component receives a relative status based on that comparison, not against an absolute standard.
Quality Score is a diagnostic tool, not an auction-time input. The 1-to-10 keyword level Quality Score you see in your account is a historical snapshot based on average past performance. In each actual Google Ads auction, Google recalculates auction-time ad quality in real time using contextual signals like the user’s device, location, time of day, and the specific search term entered. So your visible score tells you where your ads stand on average, but your actual auction-time ad quality depends on real-time signals layered on top of that.
This distinction matters. Two keywords can have the same visible Quality Score but perform very differently at auction time depending on who is searching and how. Use Quality Score as a diagnostic to identify structural problems, not as the only metric you track.
Quality Score is only available as a visible 1-to-10 number for standard Search campaigns, at the keyword level. Display and Performance Max campaigns have internal quality signals that work similarly but are not surfaced as a visible score.
A score of 7 or above across your keyword portfolio is a strong benchmark. You can find your keyword level Quality Score in Google Ads under Keywords, then Columns settings. Add Quality Score, Expected CTR, Ad Relevance, and Landing Page Experience columns to see exactly which component needs attention.
Common Mistakes That Hurt Your Google Ads Quality Score
Oversized Ad Groups
Putting 30 keywords with different intents into a single ad group and running one set of ads across all of them tanks ad relevance and expected CTR simultaneously. When copy cannot specifically address each search query, both components produce below average Quality Score statuses. For a deeper look at campaign structure, see our guide on Google Ads KPIs to measure ad performance.
Not Using Negative Keywords
Negative keywords do not directly change your Quality Score, but they protect it. Every time your ad appears for an irrelevant search query and does not get clicked, that non-click counts against your expected CTR. Over time, this pulls your CTR below the average for that keyword and pushes your Quality Score down.
Review your Search Terms Report in Google Ads weekly, especially in the first 30 days of any campaign. Add every irrelevant query you find as a negative keyword. This keeps your ads in front of users who are likely to click, which protects your expected CTR and your Quality Score over time.
Generic Landing Pages
Sending all traffic to your homepage regardless of what the user searched for creates a mismatch between ad promise and page content. Landing page experience drops, bounce rate rises, and conversion rate falls with it.
No Ad Copy Testing
Expected CTR improves when your ads earn more clicks. Running the same ad copy without testing alternatives leaves CTR gains on the table. Responsive search ads let you test multiple headline and description combinations. Google automatically serves the combinations that generate higher CTR, improving your expected CTR status over time.
Slow Landing Pages
Google explicitly factors load speed into landing page experience. Run your key landing pages through Google’s PageSpeed Insights regularly and prioritise any critical fixes flagged there.
Leaving Low-QS Keywords Running Too Long
If a keyword has a below average Quality Score – sitting at 3 or lower – after 30 or more days of running, trying to recover it incrementally is often the harder path. It is usually faster to pause it, rebuild the ad group structure around it with tighter intent grouping, and let the new structure build a clean performance history. Fresh, well-structured ad groups build keyword level Quality Scores faster than patched-up ones with a poor historical track record.
How to Improve Each Google Ads Quality Score Component
Improving Expected CTR
Write headlines that speak directly to what the user is searching for. Use numbers, specifics, and action-oriented language. Test multiple headline variations in your responsive search ads. Add ad assets, particularly sitelinks and callouts, which expand your ad’s footprint on the page and give users more reasons to click.
Google’s own data shows that ads with three or more assets see an average CTR lift of around 20%. If you are running campaigns without sitelinks and callouts, you are leaving significant CTR on the table. Our breakdown of Google Ad extensions you should use covers the most impactful options.
Also review your Search Terms Report regularly. If your ads are showing for irrelevant queries and not getting clicked, those impressions without clicks suppress your expected CTR. Adding those queries as negative keywords directly protects your CTR, which is one of the fastest ways to move from a below average to an average or above average expected CTR status.
Improving Ad Relevance
Restructure your ad groups around tightly themed keyword clusters where every keyword shares the same intent. Write separate ad copy for each theme rather than using one generic set of ads across the campaign. Include the core keyword or its close variants in at least one headline per ad group.
If you are managing a large keyword list, Dynamic Keyword Insertion (DKI) is a practical tool. DKI automatically inserts the user’s search term into your headline when the query matches your keyword. This creates a strong perceived relevance between what the user typed and what the ad says, which can improve both ad relevance status and expected CTR. Use it on tightly controlled keyword lists. On broad match or mixed-intent ad groups, DKI can produce headlines that do not make sense.
For campaigns with a large keyword list, restructuring ad groups alone can move multiple keywords from below average to average or above average ad relevance status within a few weeks.
Improving Landing Page Experience
Match your landing page headline to the promise in your ad. If the ad says “Free Google Ads Audit,” the landing page should lead with that offer. Remove generic content not relevant to the specific ad driving the traffic. Improve page load speed using Google’s PageSpeed Insights. Make your call-to-action visible without scrolling. Ensure the page works cleanly on mobile.
Include trust signals on your landing pages. Google evaluates transparency, which includes whether users can find information about who operates the site and how to contact the business. Clear contact details, a visible privacy policy, and social proof all contribute to an above average landing page experience status.
How Higher Ad Quality Reduces Your CPC in Google Ads
The relationship between Quality Score and cost per click is built directly into how Google determines the price of each click.
Ad Rank determines both your ad position and your actual CPC. A higher Quality Score improves your Ad Rank, which means you can achieve better ad positions without increasing your bid. The inverse is also true. Keywords with a below average Quality Score of 1 or 2 out of 10 can cost at least 150% more per click compared to the same keyword at a score of 5. Google also begins showing these low-scoring ads less frequently, which reduces impression share and compounds the cost problem.
Moving from QS 5 to QS 7 across your account does not simply reduce CPC by a few percent. According to Digital Applied’s 2026 benchmark analysis, the reduction in Google Ads cost per click from that improvement can exceed 40% for the same ad position. On a $10,000 AUD monthly budget, that is equivalent to getting thousands of additional clicks at no extra cost.
For any advertiser focused on CAC efficiency, improving Quality Score is one of the highest-leverage activities available. Lower CPC leads to lower cost per conversion, which improves ROAS, which gives you more budget to scale.
Our Google Ads management services include regular Quality Score audits across your keyword portfolio to identify and fix the specific components holding your scores down.
Conclusion
The three main factors that determine ad quality in Google Ads are expected CTR, ad relevance, and landing page experience. Each is measurable, each is improvable, and each has a direct impact on how much you pay per click and how often your ads show.
With 36% of all Google Ads keywords currently sitting at Quality Score 5 or below, the opportunity to reduce CPC and improve ROAS through Quality Score optimisation is significant across most accounts. A below average Quality Score on a high-value keyword is not neutral. It is actively costing you money on every single click.
Audit your keyword level Quality Score columns, identify which of the three components is pulling scores down, review your Search Terms Report for CTR-killers, and prioritise fixes in that order. The gains compound over time and the savings are real.
Want to know exactly where your Google Ads account is losing money to low Quality Score? AdtoRise conducts comprehensive Google Ads audits that identify every Quality Score weakness in your account and map a clear path to lower CPC and higher ROAS. Book your free audit today.
Frequently Asked Questions
No. Google has confirmed that bid amount does not impact your Quality Score. The three Quality Score components – expected CTR, ad relevance, and landing page experience — are assessed independently of what you bid. Your bid affects Ad Rank alongside Quality Score, but increasing your bid does nothing to change your below average or above average status on any component.
Not directly. Negative keywords do not change your keyword level Quality Score on their own. But they stop your ad from appearing for irrelevant queries where it will not get clicked. Since non-clicks on irrelevant searches pull down your expected CTR over time, consistent negative keyword management protects and gradually lifts your Quality Score indirectly. Review your Search Terms Report weekly to find new terms to exclude.
Quality Score updates continuously as your ads accumulate data. Expected CTR can shift relatively quickly when CTR changes are significant. Ad relevance and landing page experience update as Google reassesses your account. Newly added keywords without enough impression data will show a dash in the Quality Score column rather than a number.
No. The 1-to-10 keyword level Quality Score in your Google Ads account is a historical diagnostic based on your average past performance. In each Google Ads auction, Google recalculates auction-time ad quality in real time using contextual signals like device, location, time of day, and the specific search term. Your visible score is a useful diagnostic tool, but it is not the same as what Google uses at auction time, which varies with every single search.
A below average status on any of the three components means your ad is underperforming relative to other advertisers competing for the same keyword over the past 90 days. Below average expected CTR means users are clicking your ad less often than the average. Below average ad relevance means your copy does not closely match search intent. Below average landing page experience means your post-click page is not meeting user expectations. Each status points to a specific fix.
Partially. Because Ad Rank combines bid and quality signals, a high Quality Score can allow you to rank above advertisers who bid more than you but have weaker ad quality. This is one of the core reasons Quality Score optimisation matters: it lets smaller-budget advertisers compete with larger ones on merit rather than spend alone.
A score of 7 or above on your core keywords is a strong benchmark. Scores of 8 to 10 indicate well-optimised ads with strong above average component statuses. Scores below 5 on important keywords signal active problems increasing your costs and should be prioritised for improvement.
If a keyword has a below average Quality Score of 3 or lower after 30 or more days of running, and you have already improved the ad copy and landing page, it is often faster to pause it and rebuild the ad group around it from scratch. New keywords in a well-structured ad group build keyword level Quality Score faster than trying to recover one with a poor historical track record.
Quality Score as a visible 1-to-10 keyword level score is specific to standard Search campaigns. Display and Performance Max campaigns have internal quality signals that influence auction-time ad quality in similar ways but are not surfaced as a visible score. For Search campaigns, every keyword gets its own score, and that is where Quality Score optimisation has the most direct and measurable impact on CPC.
A check every 30 to 60 days is a reasonable cadence for most accounts. Focus on high-spend keywords first. Identify which of the three Quality Score components is pulling scores down and prioritise fixes in that order. Run your Search Terms Report monthly alongside this to catch CTR-killers before they do long-term damage.